
AI for Sustainability
A 2026 Decision-Making Framework for Decarbonization Initiatives
How enterprises rank decarbonization initiatives using MACC and the Net Benefit formula under CBAM, EU ETS, and CSRD in 2026.
Sofia Fominova
Apr 19, 2026

TL;DR. A decarbonization decision-making framework ranks every candidate initiative by its marginal abatement cost in euros per tonne of CO₂e, then filters the resulting list through net benefit, execution risk, and strategic fit before capital is released. Net0, an AI infrastructure company serving governments and global enterprises, automates this end-to-end — from Scope 1, 2, and 3 baseline measurement to MACC generation, scenario simulation, and continuous re-ranking as carbon prices and technology costs move.
Key Takeaways
The Q1 2026 CBAM certificate price is €75.36 per tonne of CO₂e, published by the European Commission on 7 April 2026, effectively setting a floor for enterprise internal carbon pricing (European Commission CBAM portal).
The EU Emissions Trading System has traded in the €70–84 per tonne range in late 2025 and early 2026, tying every tonne of in-scope emissions directly to cash flow.
Modern Marginal Abatement Cost Curves now cover 1,400+ decarbonization levers across 170 value chains, compared to roughly 150 levers in the 2010s, according to McKinsey's Understanding the price of decarbonization.
Approximately 50% of sector emission reductions can be achieved at zero or negative net cost when ranked on a MACC, meaning half the abatement portfolio pays for itself before any carbon price is applied.
CBAM, CSRD, CSDDD, SFDR, and the EU Taxonomy now form a unified regulatory system in 2026 that links sustainability performance to cost of capital, making a defensible prioritisation framework a board-level requirement, not a nice-to-have.
Why 2026 Has Reset the Economics of Decarbonization
The decision-making framework that worked in 2022, when carbon was largely a compliance footnote, is no longer fit for purpose. Three regulatory and market shifts have moved the cost of inaction onto the balance sheet.
First, the CBAM financial phase went live on 1 January 2026, requiring EU importers of steel, cement, aluminium, fertilisers, electricity, and hydrogen to surrender CBAM certificates proportional to the embedded emissions of what they import. The Q1 2026 certificate price is €75.36/tCO₂e. The CBAM factor is 2.5% in 2026, 5% in 2027, 10% in 2028, and reaches 100% by 2034 as EU ETS free allocation is phased out, creating a rising, predictable carbon liability for any supply chain touching the EU.
Second, the EU ETS itself has traded in the €70–84/tCO₂e range through late 2025 and early 2026, making a tonne of covered emissions a real, liquid price signal. For installations in aviation, power, heavy industry, and from 2027 buildings and road transport under ETS2, every tonne of CO₂ has a direct cash cost.
Third, the CSRD double materiality regime, together with CSDDD due diligence obligations and SFDR disclosures, now requires large enterprises to quantify both their impact on the climate and climate-related financial risks on their own operations. This directly affects access to capital, credit ratings, and supplier qualification, as Plan Be Eco sets out in its 2026 regulatory synthesis.
The implication is that decarbonization is no longer one workstream among many. It is a capital allocation problem with a known price per tonne and a known disclosure obligation, and it needs the same rigour as any other enterprise capex decision.
What a Decarbonization Decision-Making Framework Is
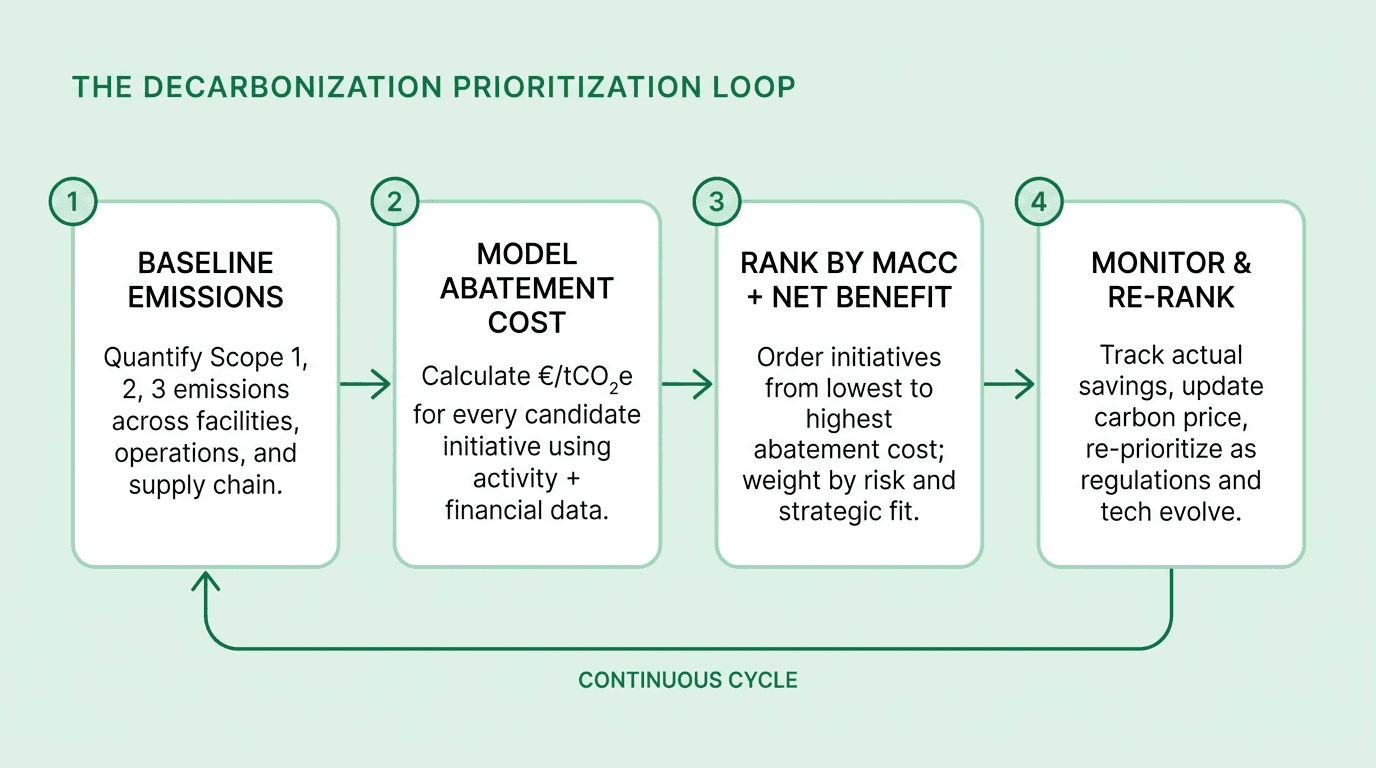
A decarbonization decision-making framework is a structured method for evaluating, ranking, and selecting emissions-reduction initiatives using consistent financial, climate, risk, and strategic criteria. The goal is to move from a scattered backlog of "green projects" to a prioritised, budget-constrained portfolio that delivers the largest emissions reduction per euro invested, within the execution capacity of the organisation.
A credible framework has four filters, applied in order:
Marginal abatement cost — what each initiative costs per tonne of CO₂e avoided over its lifespan.
Net benefit — the full economic value, after accounting for avoided carbon liability and opex savings.
Execution risk — the probability and magnitude of cost or schedule overrun, technology underperformance, or regulatory change.
Strategic fit — whether the initiative reinforces disclosure obligations, customer expectations, or the company's science-based target pathway.
Every candidate initiative must pass through all four. A project that clears marginal abatement cost but fails execution-risk scoring is not ready for capital; a project that is strategically central but economically catastrophic needs to be redesigned or sequenced differently.
The Marginal Abatement Cost Curve (MACC) Explained
A Marginal Abatement Cost Curve is a bar chart that orders every candidate initiative from cheapest to most expensive on a per-tonne basis. Each bar has two dimensions that matter: bar height is the abatement cost in €/tCO₂e, and bar width is the annual abatement volume in tCO₂e per year. The area of each bar is the total annual cost or saving.
Bars below the horizontal axis represent initiatives that generate a net saving — their lifetime opex reduction exceeds the upfront and ongoing cost, before any carbon price is applied. LED retrofits, HVAC optimisation, controls and metering, and leak detection typically sit here. Bars above the axis represent initiatives that require net investment — heat pumps, fleet electrification, on-site renewables, and green hydrogen typically sit here, with the higher-cost bars further right.
According to the Fiegenbaum Solutions MACC primer, synthesising McKinsey's underlying analysis, around half of achievable sector reductions can be captured at zero or negative net cost. The implication for most enterprises is that the first wave of decarbonization investment does not need a carbon price to clear the hurdle rate.
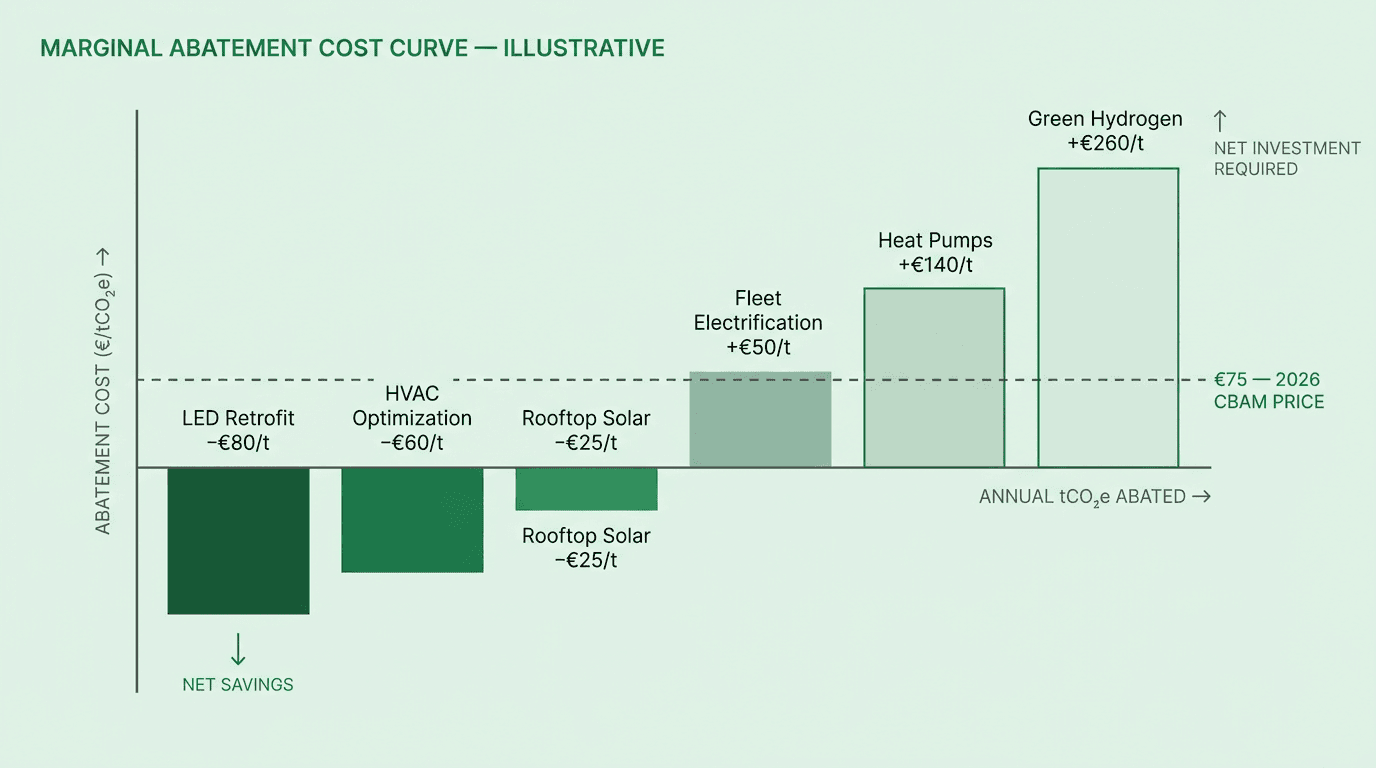
Overlaying the current CBAM price (€75/tCO₂e) or the EU ETS price as a horizontal line turns the MACC into a decision tool. Every bar below the line is economically justified on carbon value alone. Every bar above the line requires additional strategic rationale — regulatory compliance, customer mandate, science-based target pathway, or future carbon price expectations — to make the case for investment today.
The Net Benefit Formula
Marginal abatement cost ranks initiatives. Net benefit quantifies the absolute value of each one. The Net Benefit (NB) formula used in Net0's framework synthesises every relevant variable into a single figure:
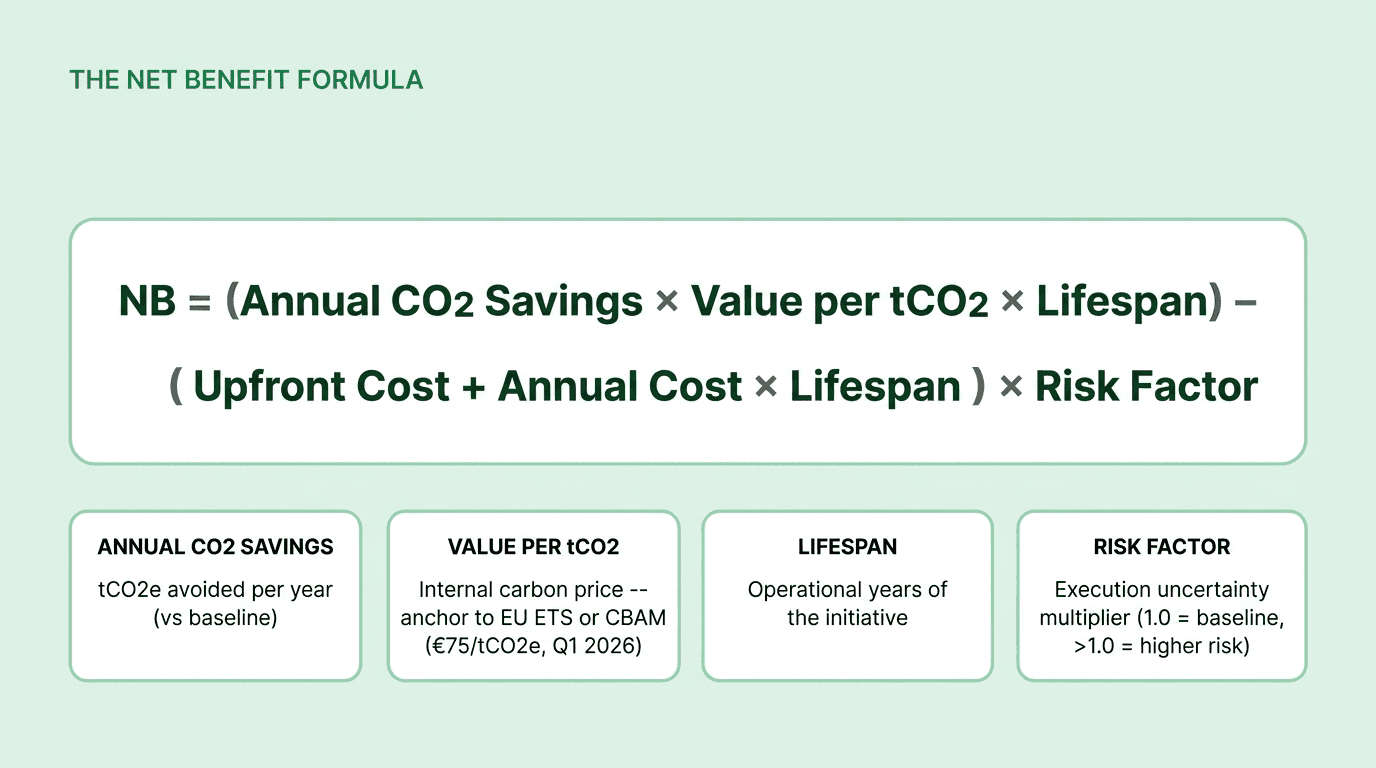
Annual CO₂ Savings is the tonnes of CO₂e avoided each year, measured against a quantified baseline built from Scope 1, 2, and 3 emissions data. This is the single variable most likely to be wrong in practice, which is why the quality of the carbon accounting methodology underneath the framework matters more than the sophistication of the financial model on top.
Value per tCO₂ is the internal carbon price used in the evaluation. In 2026, the defensible anchor is the EU ETS forward curve or the CBAM certificate price (€75.36/tCO₂e in Q1 2026), adjusted upward over the project lifespan for expected CBAM and ETS2 trajectories. Using a stale €25 internal price from 2020 will systematically under-invest in abatement.
Upfront Cost and Annual Cost cover the full economic profile of the initiative, including capex, installation, maintenance, energy cost changes, and residual value. For initiatives that generate opex savings, the annual cost term is negative.
Lifespan is the operational life of the initiative. A five-year LED retrofit and a twenty-year solar array cannot be compared at a single year's cash flow — the lifespan term does the work of converting annual savings into lifetime value.
Risk Factor is the execution multiplier applied to the cost side. A well-understood, proven technology in a supportive regulatory environment might use 1.05; a first-of-a-kind installation in a volatile regulatory regime might use 1.3 or higher.
A positive NB means the project is viable on its own economics. A negative NB means the project can only be justified by non-economic factors — brand, employee engagement, strategic optionality — and needs to be recognised as such.
Three Worked Scenarios, Recalibrated for 2026
The same three scenarios that illustrated this framework in earlier Net0 analyses — a green rooftop garden, an LED retrofit, and a rooftop solar installation — look materially different under 2026 carbon economics. The table below applies the €75/tCO₂e CBAM-anchored internal carbon price to each project over its stated lifespan.
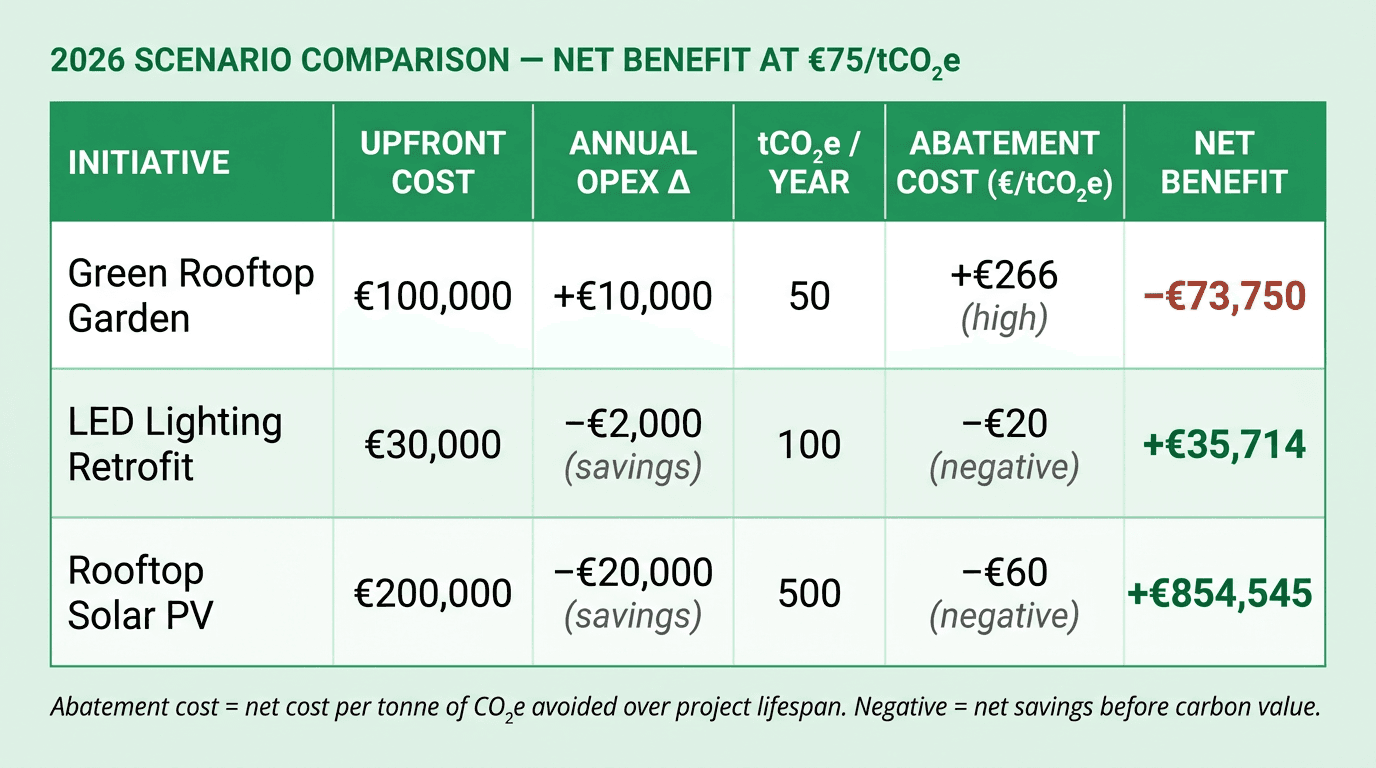
The Green Rooftop Garden remains a negative-NB project. Modest abatement of 50 tCO₂e per year at a high €266/tCO₂e cost, after applying the €75 carbon value, still returns a net benefit of roughly −€73,750 over ten years with a 1.2 risk factor. The garden may be justified on biodiversity, employee experience, or ESG storytelling grounds, but it should be recognised as a marketing and real-estate decision, not a decarbonization investment.
The LED Lighting Retrofit is the clearest "no-regret" win. At −€20/tCO₂e it sits below the horizontal axis on the MACC and returns a positive NB of approximately €35,714 over five years even before any carbon value is applied. The opex savings alone justify the capex. This is the archetypal initiative that should move first in any enterprise portfolio and against which more speculative projects are benchmarked.
Rooftop Solar PV is the long-duration compounder. With 500 tCO₂e per year of avoided emissions, a 20-year lifespan, and a −€60/tCO₂e abatement cost, NB rises to approximately €854,545 at the 2026 carbon price, before factoring in self-consumption hedging value and power purchase agreement economics. Rising CBAM and ETS trajectories further strengthen the case over the project's operational life.
The pattern is general: beautiful-sounding projects with low emissions impact and high maintenance cost rarely survive a disciplined MACC. Unglamorous efficiency retrofits almost always do. On-site renewables and electrification sit between the two, with outcomes determined by local energy prices, grid carbon intensity, and lifespan.
From Spreadsheet MACC to AI-Generated MACC
The hard part of a decarbonization decision-making framework is not the formula; it is the data. Every variable in the NB equation — baseline emissions, abatement volume, capex, opex delta, lifespan assumption, risk factor — must be generated from source systems across finance, operations, energy management, fleet telematics, procurement, and supplier data. Doing this once in a spreadsheet is expensive. Doing it continuously, across every facility and every Scope 3 category, at enterprise scale, is impossible by hand.
This is where AI infrastructure changes the economics of the framework itself. McKinsey's Catalyst Zero platform, for example, automatically maps business activities to 1,250+ decarbonization levers across 750+ value chains, ingests data directly from ERP systems and cloud environments, and reports a 190% reduction in sustainability reporting cost and time. The McKinsey decarbonization reference dataset itself has expanded from roughly 150 levers in the 2010s to more than 1,400 levers across 170 value chains today.
The effect is that MACC generation shifts from a once-a-year consultancy deliverable to a continuously updated internal capability, re-ranked whenever:
The ETS or CBAM certificate price moves.
Technology costs shift (for example, the IEA reports that solar PV module prices have fallen roughly 80% since 2010 and continue to decline).
New emissions data arrives from a plant, vehicle, or supplier.
A new regulation — ETS2, CBAM extensions, a national industry scheme — widens the scope of priced emissions.
An initiative underperforms its assumed abatement or overshoots its assumed cost.
The resulting portfolio is not static. It is a living queue, and the organisations that will allocate capital best through 2030 are those whose queue updates weekly or monthly, not annually.
Common Pitfalls in Decarbonization Prioritisation
Even well-intentioned frameworks fail when they make one of the following errors:
Using a carbon price that is too low. Modelling initiatives at €20/tCO₂e when the actual CBAM and ETS prices are €70–80 understates the value of abatement and biases decisions toward inaction. The internal carbon price must track real market signals, and ideally forward curves, not historical averages.
Ignoring Scope 3. For most enterprises, 70–95% of total emissions sit in Scope 3 value chain categories — upstream purchased goods, product carbon footprint, transportation, and use-phase emissions. Frameworks that only prioritise Scope 1 and 2 miss the majority of the abatement curve and the majority of CBAM and CSRD exposure.
No execution-risk weighting. Treating a proven LED swap and a first-of-a-kind hydrogen pilot as comparable projects overstates the deliverable portfolio. Every initiative needs an explicit risk factor that flows through the NB calculation.
One-off analysis instead of continuous re-ranking. A MACC built in Q1 2024 is already stale. Carbon prices, input costs, and regulations all moved materially in 2025 and 2026. Any framework that is not wired into live emissions and financial data will drift from reality within twelve months.
Omitting disclosure and compliance value. Some initiatives pay back through improved GHG Protocol reporting, CDP, IFRS S1/S2, ESRS, or GRI disclosures rather than through direct emissions reduction. Frameworks that ignore the regulatory layer will systematically under-invest in data infrastructure.
How Net0 Operationalises This Framework
Net0 provides the AI infrastructure that makes a disciplined decarbonization decision-making framework workable at Fortune 500 and government scale. The Net0 sustainability platform automates the pipeline from source data to prioritised portfolio:
Baseline measurement across Scope 1, 2, and 3, ingested from 10,000+ enterprise systems including ERP, energy management, fleet telematics, facilities, and procurement.
Activity-to-lever mapping using 50,000+ emission factors and 60+ modular AI applications, so every operational activity is linked to a candidate abatement lever with a cost, volume, and lifespan estimate.
Automated MACC generation that ranks initiatives in real time against a user-defined internal carbon price — anchored to EU ETS, CBAM, or a custom shadow price.
Scenario simulation against 30+ reporting frameworks, including CSRD, CDP, IFRS S2, SBTi, and the SEC Climate Rule, so portfolio choices can be evaluated against both financial return and disclosure impact.
Continuous monitoring of actual versus forecast abatement and cost, with variance triggers that re-run the prioritisation whenever an assumption is breached.
Sovereign, hybrid, and cloud deployment so that data sovereignty, security, and audit requirements can be met for both enterprise and government customers.
The outcome is that sustainability, finance, and operations teams work off a single live prioritised queue, rather than three competing spreadsheets. Capital moves first to the negative-cost wedge, then to the initiatives whose abatement cost sits below the prevailing carbon price, and finally — with explicit strategic justification — to the longer-dated, higher-cost levers that a 1.5°C pathway ultimately requires.
For a wider view on making this economically durable, Net0's analyses of a profitable decarbonisation strategy and of automated data collection sources extend the framework into strategy and data infrastructure respectively.
Put the Framework Into Practice
A decision-making framework only creates value when it is running against live data. Book a demo to see how Net0 automates MACC generation, net benefit analysis, and continuous re-ranking across an enterprise portfolio, and to walk through a worked example using your own emissions and financial data.
FAQ
What is a decarbonization decision-making framework?
A decarbonization decision-making framework is a structured method for ranking and selecting emissions-reduction initiatives using marginal abatement cost, net benefit, execution risk, and strategic fit. It converts a scattered backlog of "green projects" into a prioritised capex portfolio aligned with the organisation's carbon price, disclosure obligations, and net-zero pathway.
What is a Marginal Abatement Cost Curve (MACC)?
A MACC is a bar chart that orders decarbonization initiatives from cheapest to most expensive per tonne of CO₂e. Bar height shows cost in €/tCO₂e, bar width shows annual abatement volume. Bars below the axis generate net savings; bars above the axis require investment. Overlaying the EU ETS or CBAM price turns a MACC into a capital allocation tool.
Which carbon price should enterprises use internally in 2026?
The defensible 2026 anchor for an internal carbon price is the EU ETS forward curve or the CBAM certificate price, which was €75.36/tCO₂e in Q1 2026 per the European Commission. Enterprises should also model rising trajectories through 2034 as the CBAM factor scales from 2.5% to 100% and EU ETS free allocation is phased out.
How does CBAM affect decarbonization prioritisation?
The CBAM financial phase, live since 1 January 2026, charges EU importers of steel, cement, aluminium, fertilisers, electricity, and hydrogen for embedded emissions at the CBAM certificate price. This converts supply-chain carbon intensity into direct cash cost, making supplier decarbonization and lower-carbon input sourcing high-priority levers on any MACC serving EU-exposed enterprises.
How is AI used in MACC generation?
AI automates the data pipeline that a MACC needs: ingesting activity data from ERP and operational systems, mapping activities to 1,400+ decarbonization levers across 170 value chains, applying emission factors, estimating abatement costs, and re-ranking initiatives whenever carbon prices, costs, or regulations move. McKinsey reports 190% reductions in sustainability reporting cost and time from automation, per its Catalyst Zero documentation.
What are the most common mistakes in decarbonization prioritisation?
The most common mistakes are using an internal carbon price that is too low, ignoring Scope 3 emissions that typically represent 70–95% of the footprint, treating proven and unproven technologies as equally risky, running a one-off analysis that ages out within a year, and failing to price in the disclosure and compliance value of data infrastructure investments.
