
AI for Sustainability
Automated Carbon Data Collection: Key Sources and AI Methods for Enterprise Reporting
The ten enterprise data sources behind a complete carbon inventory — and how AI automates collection across Scope 1, 2, and 3 for CSRD, IFRS S2, and CDP reporting.
Sofia Fominova
Apr 21, 2026

TL;DR
Automated carbon data collection pulls emissions-relevant information from ten enterprise source categories — invoices, ERP, IoT meters, supplier data, travel and logistics systems, procurement, cloud infrastructure, employee data, product lifecycle records, and external factor databases — and converts it into an audit-ready inventory using AI. In 2026, this is the only realistic way for a global enterprise to report under CSRD, IFRS S2, and GHG Protocol at the cadence their stakeholders now expect.
Key Takeaways
88% of executives name data quality as a top sustainability reporting challenge, and 57% call it their leading concern (Deloitte 2024 Sustainability Reporting Survey).
Supply chain emissions are on average 26x higher than a company's direct Scope 1 and 2 emissions, yet only 15% of companies disclosing to CDP have set a Scope 3 target (CDP and BCG, 2024).
Only 9% of companies comprehensively report Scope 1, 2 and 3 emissions today (BCG and CO2 AI 2024 Carbon Survey, n = 1,864 executives).
Companies using AI for decarbonization are 4.5x more likely to see significant emissions-reduction benefits and report average net financial benefits of ~$200M per year among the top quartile (BCG 2024).
As of mid-2025, 36 jurisdictions have adopted or are introducing IFRS S2, making automated, multi-framework data collection a structural requirement for large enterprises (IFRS Foundation, 2025).
Introduction
Net0 is an AI infrastructure company that builds AI solutions for governments and global enterprises, with a sustainability platform that handles automated carbon data collection at institutional scale — millions of invoices per month, 10,000+ enterprise system integrations, and 50,000+ emission factors across 30+ reporting frameworks. For Heads of Sustainability and CFOs, the foundational question is no longer whether to automate data collection, but which sources to prioritize and how AI can turn them into an audit-ready inventory.
Carbon accounting fails or succeeds at the data layer. Even the most sophisticated decarbonization strategy collapses when the underlying inventory is incomplete, inconsistent, or two quarters out of date. This article maps the ten essential data-source categories an enterprise needs for a complete Scope 1, 2 and 3 inventory, explains how AI automates each, and shows how the result plugs into frameworks like CSRD, IFRS S2, GHG Protocol, and GRI.
The ten essential data sources for enterprise carbon accounting
Global organizations typically need data from ten distinct categories to build a complete emissions inventory. Each has its own systems of record, data quality issues, and AI automation pattern.
1. Operational and financial documents
Invoices, utility bills, waste manifests, fuel receipts, and expense reports are the single largest source of Scope 1 and Scope 2 data for most enterprises. They are also the most painful — historically processed by hand, line by line.
Modern carbon platforms apply intelligent document processing (IDP): large language models extract supplier, commodity, quantity, unit, currency, and date fields from PDFs, scanned paper, and email attachments, then map them to emission factors automatically. Net0 processes millions of invoices per month this way, extracting structured activity data without human transcription.
Sources to connect: electricity, gas, water, and waste utility bills; fuel card statements; refrigerant refill invoices; waste disposal manifests; corporate card and T&E receipts.
2. Enterprise resource planning and procurement systems
ERP platforms — SAP S/4HANA, Oracle Fusion, Microsoft Dynamics 365, Workday — are the system of record for purchased goods and services, which typically drive the largest Scope 3 category (Category 1, "Purchased Goods and Services"). Procurement systems (Coupa, Ariba, Ivalua) hold supplier metadata and line-item purchase history.
API-based ingestion pulls transactional records continuously and applies spend-based or hybrid emission factors. Machine-learning classification assigns each transaction to the correct GHG Protocol Scope 3 category, replacing the manual GL-to-category mapping that stalls most sustainability programs.
3. Energy and resource monitoring systems
Smart meters, sub-meters, IoT sensors, and building management systems (BMS) generate high-frequency energy data for Scope 1 (on-site fuel) and Scope 2 (purchased electricity, steam, heating, cooling). BMS platforms such as Siemens Desigo, Honeywell EBI, and Johnson Controls Metasys are the richest on-site source; fleet telematics do the same for mobile combustion.
Streaming ingestion with time-series normalization turns raw meter readings into hourly or sub-hourly emissions figures and — critically — exposes anomalies early. With market-based Scope 2 accounting now the default under most frameworks, hourly matching against renewable energy certificates (RECs) and power purchase agreements (PPAs) is becoming the new expectation rather than a leading-edge practice.
4. Supplier and value chain data
For customer-facing enterprises, the supply chain generates on average 11.4x more emissions than in-house operations, per the World Economic Forum, and CDP data puts the multiplier at 26x for the average corporate respondent. Yet in Deloitte's 2024 survey, only 15% of companies were prepared to disclose Scope 3 at the level CSRD and IFRS S2 now require.
Automated supplier engagement closes this gap through four mechanisms:
Supplier portals that request product- or activity-level footprints from each vendor and validate them against industry benchmarks.
EDI and API integrations with logistics providers (Maersk, DHL, UPS, Flexport) that return verified shipment-level emissions.
Primary-to-secondary data fallback — where supplier-specific data exists, use it; otherwise default to spend-based or average-data factors and flag for follow-up.
Supplier risk scoring that concentrates engagement effort on the 20% of suppliers driving 80% of emissions.
5. Corporate travel and employee mobility
Travel management companies (Concur, Egencia, TravelPerk, Amex GBT) hold flight, hotel, and rail data at the booking-reference level. HR systems (Workday, SAP SuccessFactors, BambooHR) contain commuting surveys and remote-work patterns that feed Scope 3 Category 7 ("Employee Commuting") and, where relevant, Category 8 ("Upstream Leased Assets") or home-office energy allocations.
Automated ingestion applies segment-level emission factors (by flight class, aircraft type, hotel region, and grid intensity) rather than trip-level averages — a distinction that materially changes reported footprints and, under CSRD double materiality, changes disclosed mitigation levers.
6. Logistics and transportation
Freight and inbound/outbound logistics touch Scope 3 Categories 4 and 9 ("Upstream Transportation and Distribution" and "Downstream Transportation and Distribution"). Transportation management systems (Oracle TMS, Blue Yonder, Manhattan Associates), 3PL portals, and customs brokerage files contain mode, distance, weight, and container-level detail.
AI can normalize across modes (sea, air, road, rail), apply the Global Logistics Emissions Council (GLEC) Framework consistently, and combine primary carrier data with modelled estimates to cover gaps. This replaces the common practice of estimating freight emissions from a single spend line.
7. Cloud and IT infrastructure
Cloud workloads are an increasingly material source. AWS, Microsoft Azure, and Google Cloud all publish region-level carbon footprint reports, and internal data centre energy can be pulled from asset management systems and DCIM tools.
API-based pulls from cloud billing and carbon APIs convert compute, storage, and network usage into emissions by region and workload. For large enterprises migrating to AI-heavy workloads, data centre emissions are becoming a standing Scope 3 Category 8 or Scope 2 item rather than an afterthought. IEA's Energy Efficiency 2024 analysis notes that data centre demand is one of the fastest-growing drivers of global electricity consumption.
8. Product lifecycle and end-use data
For manufacturers, product-level emissions under Scope 3 Categories 10, 11 and 12 ("Processing of Sold Products," "Use of Sold Products," "End-of-Life Treatment") require bill-of-materials (BOM) data from PLM systems (PTC Windchill, Siemens Teamcenter, Dassault ENOVIA), usage telemetry from connected products, and end-of-life assumptions from LCA databases (ecoinvent, Sphera).
AI automates cradle-to-gate Product Carbon Footprint (PCF) calculation by joining BOM data to lifecycle inventories, applying allocation rules, and generating the disclosure formats required by customers and regulators. BCG found that companies calculating product-level emissions are 4x more likely to see significant decarbonization benefits (BCG 2024 Carbon Survey).
9. External emission factor and regulatory databases
Emission factors are the multipliers that convert activity data to CO2-equivalent. The authoritative sources — GHG Protocol factor databases, US EPA eGRID, UK DEFRA, IEA, ecoinvent, IPCC — are updated on different cycles and in different structures.
An enterprise-grade carbon platform maintains a live, versioned emission factor library (Net0 maintains 50,000+), automatically selects the correct regional grid factor based on facility location and reporting framework, and preserves the factor version used for each calculation so auditors can trace any emissions figure back to its source. This versioning is a non-negotiable requirement under IFRS S2 and the CSRD's ESRS E1 climate standard.
10. Financial, HR, and asset management systems of record
General ledgers, fixed-asset registers, and HR headcount systems provide the denominators for emission intensity metrics (per revenue, per employee, per square metre, per unit produced) and the organizational boundary data that defines which entities are in scope.
AI-driven entity mapping keeps the emissions inventory aligned with the legal-entity structure as the business grows, divests, or restructures — without which carbon disclosures drift out of alignment with audited financial statements, a common finding in pre-assurance readiness reviews.
From data source to audit-ready inventory
Collecting data from ten source categories is necessary but not sufficient. The value comes from a pipeline that consistently turns raw transactions, meter readings, and supplier disclosures into a calculated, scope-tagged, framework-mapped inventory that an external auditor can sign off on.
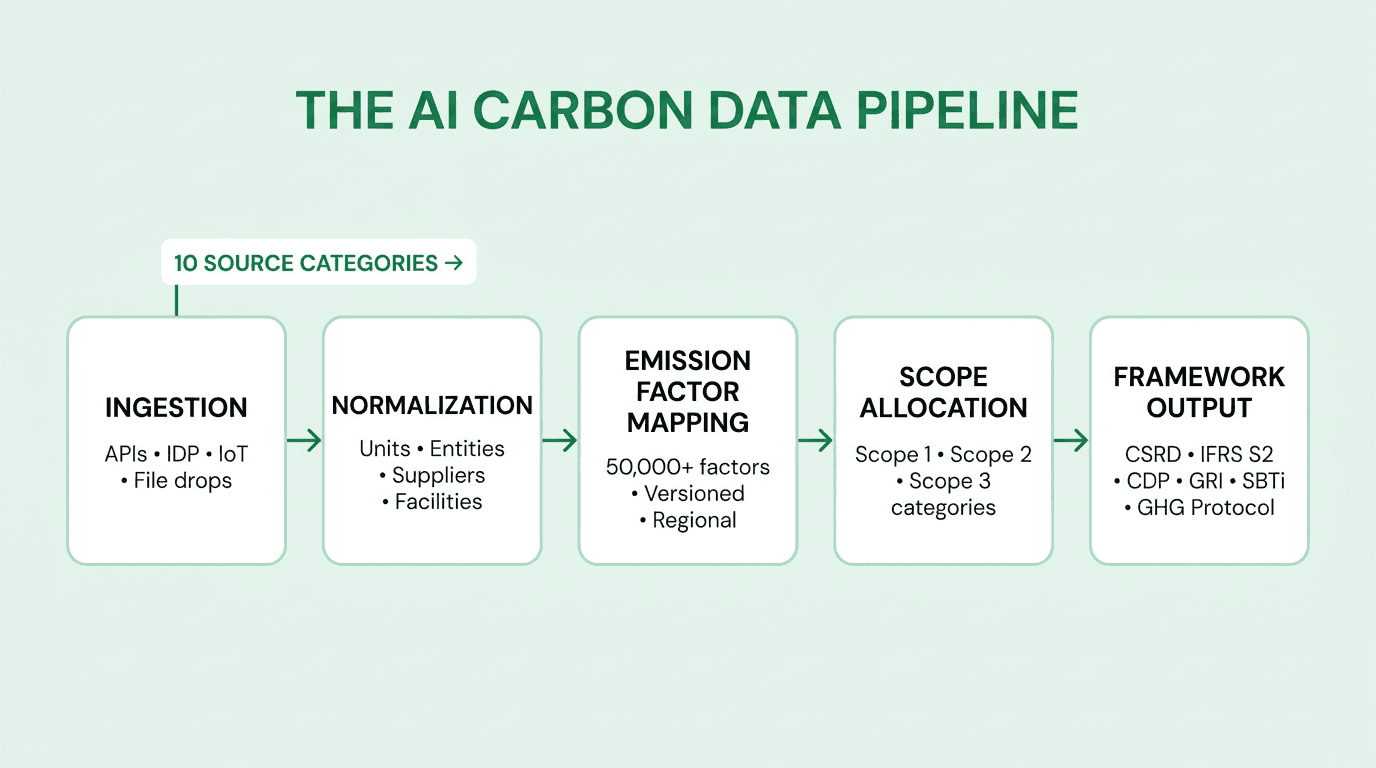
The architecture has five stages:
Ingestion — pull raw records from each source (APIs, file drops, email, IDP, IoT streams) and land them in a staging layer with full provenance metadata.
Normalization — resolve units, currencies, entity names, facility IDs, and supplier identifiers so that a kWh from an SAP extract and a kWh from a utility invoice are the same record in the same place.
Emission factor mapping — apply the correct factor by activity type, region, year, and framework, preserving factor version for every calculation.
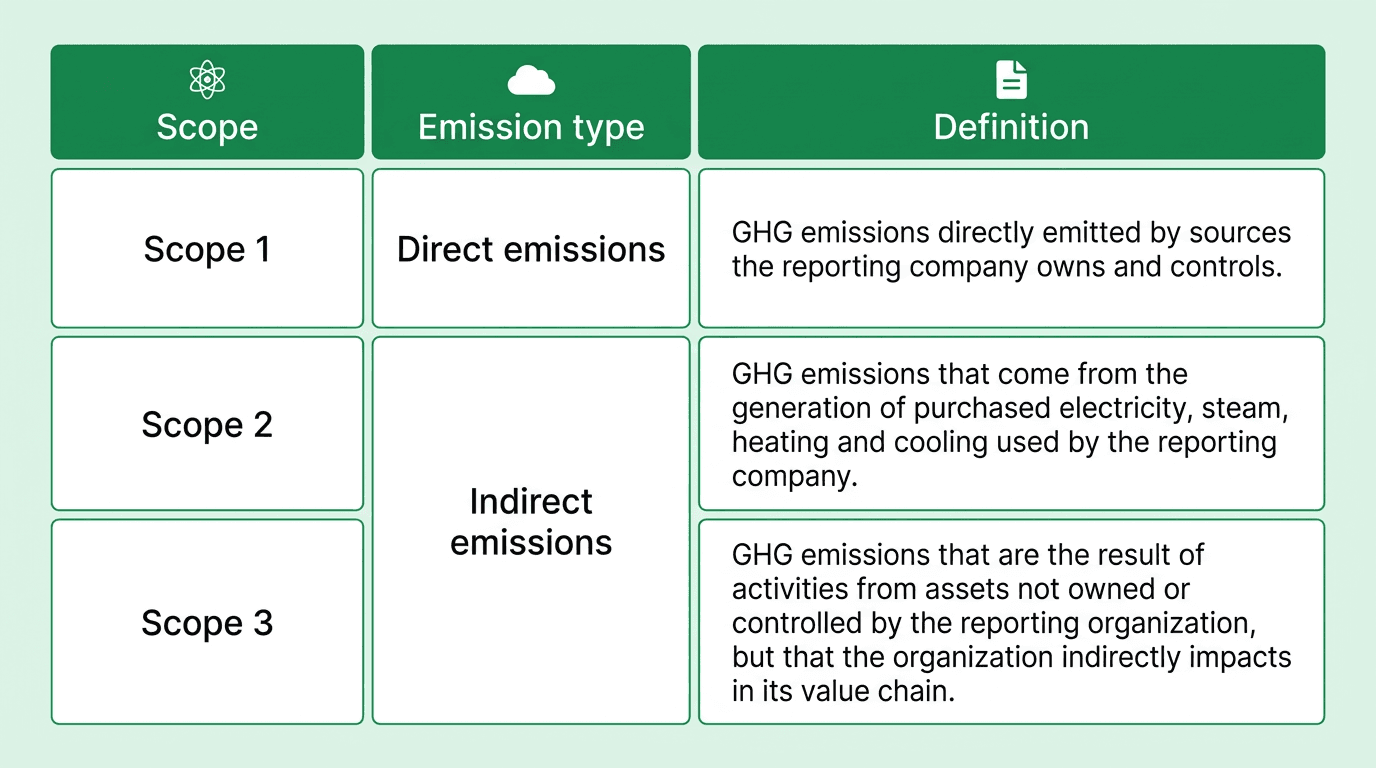
Scope allocation — tag each record to Scope 1, 2, or 3 and, for Scope 3, to the correct GHG Protocol category; see the Scope 1, 2, 3 explainer for category definitions.
Framework output — serve the same underlying inventory into CSRD, IFRS S2, CDP, GRI, SBTi, and internal management dashboards without manual re-work.
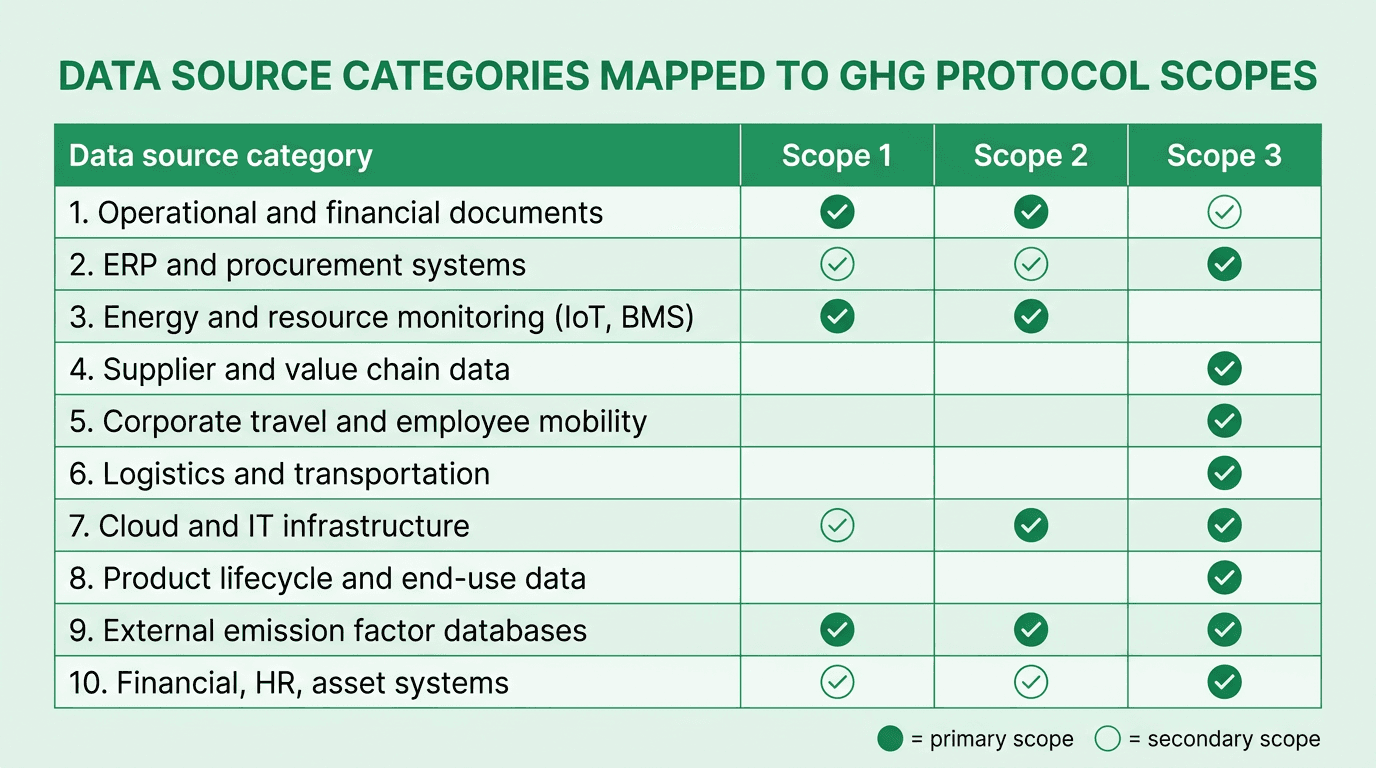
Mapping the ten data-source categories to Scope 1, 2 and 3
Different sources feed different scopes. The table below maps the ten categories above against the GHG Protocol's scope boundaries so sustainability teams can prioritize integrations by disclosure gap.
Why AI-automated collection is now the enterprise standard
Three forces have pushed automated carbon data collection from "nice-to-have" to non-negotiable:
1. Regulation at global scale. Although the European Commission's 2025 Omnibus package narrowed the CSRD population, it still covers companies with more than 1,000 employees and over €450M in revenue, plus non-EU parents meeting those EU-revenue thresholds (European Commission, 2025). In parallel, 36 jurisdictions have adopted or are introducing IFRS S2, including the UK, Japan, Australia, Singapore, Hong Kong, Canada, Brazil, and the GCC (IFRS Foundation, 2025). The US SEC's 2024 climate rule remains stayed pending litigation — but state-level rules, including California's SB 253 and SB 261, continue to require Scope 1, 2 and Scope 3 disclosure from companies operating in the state.
2. Data quality is the binding constraint. 88% of executives name data quality as a top challenge and 57% as their leading concern (Deloitte 2024). Manual collection cannot keep up with quarterly cadence, limited-to-reasonable assurance transitions, or the 270+ major buyers that requested disclosure from approximately 45,000 suppliers through CDP in 2025 (CDP Keeping Pace, 2025).
3. AI materially changes the economics. BCG's 2024 survey of 1,864 executives found companies using AI are 4.5x more likely to see significant decarbonization benefits, and the top quartile reports average net financial benefits of around $200M per year, equivalent to 7% of sales (BCG 2024 Carbon Survey). McKinsey's own Catalyst Zero platform reports approximately 90% reductions in cost and time for MACC generation and sustainability reporting (McKinsey, 2024).
When the data layer is automated, the rest of the program — target setting, decarbonization planning, profitable decarbonization, scenario simulation, Marginal Abatement Cost Curve analysis — becomes viable at institutional scale.
How Net0 automates enterprise carbon data collection
Net0's sustainability platform is purpose-built for the ten data categories above. It maintains 10,000+ pre-built integrations spanning ERP, procurement, travel, logistics, cloud, utility, and HR systems; applies 50,000+ versioned emission factors with full audit trails; and feeds 30+ reporting frameworks — CSRD/ESRS, IFRS S2, GHG Protocol, CDP, SBTi, GRI, and SECR — from the same underlying inventory.
The AI layer processes millions of invoices per month, classifies Scope 3 transactions at line-item granularity, normalizes supplier data from both portals and primary APIs, and produces assurance-ready outputs for Big Four auditors. Deployment options include sovereign and hybrid cloud for governments and regulated enterprises that cannot place carbon data in public clouds.
Net0 serves 400+ entities across four continents, including Fortune 500 operators and national governments — the scale required to validate that an AI-first data collection architecture works under production conditions.
Book a demo to see how Net0 builds an audit-ready carbon inventory from your existing enterprise systems.
FAQ
What counts as "automated" carbon data collection?
Automated carbon data collection means emissions-relevant data flows into the inventory from source systems without manual re-keying — via APIs, file drops, IoT streams, or AI-based document extraction — and is mapped to emission factors and scopes on arrival. Spreadsheet uploads are transitional, not automated.
Which data source is the hardest to automate?
Scope 3 supplier-specific data. Internal systems are controlled integrations, but supplier data depends on thousands of third parties with varying maturity. The pragmatic path combines primary data where suppliers can provide it, spend-based factors where they cannot, and supplier engagement prioritized by emissions contribution.
Do I need every one of the ten data sources on day one?
No. Most enterprises stage integrations by scope materiality: utility bills and ERP first (covering most Scope 1, 2 and a large share of Scope 3 Category 1), then travel, logistics, and supplier portals, then IoT and product lifecycle data. A staged approach gets to a baseline inventory in weeks, not years.
How does AI improve data quality rather than just speed?
AI adds three quality layers beyond speed: anomaly detection that flags implausible readings against historical baselines, classification consistency that applies the same Scope 3 category logic across millions of transactions, and provenance tracking that preserves source, factor version, and calculation logic for every figure — the foundation for reasonable assurance.
What reporting frameworks does automated data collection have to support?
At minimum, GHG Protocol (the base accounting standard), IFRS S2, CSRD/ESRS E1, CDP, and SBTi. Large enterprises typically also need GRI, TCFD-aligned disclosures, national frameworks (SECR in the UK, California SB 253/261), and customer-specific questionnaires.
How do automated systems handle emission factor updates?
They version the factor library. When DEFRA, eGRID, or ecoinvent publish new factors, the platform ingests them and re-runs calculations under the new factors while preserving the prior version for historical periods. Auditors can trace any disclosed figure to the specific factor version and source used at the time of reporting.
Is automated data collection consistent with data sovereignty requirements?
Yes, when the underlying platform supports sovereign deployment. Governments and regulated enterprises increasingly require carbon data to remain within a specific jurisdiction. Net0's AI infrastructure supports sovereign and hybrid cloud options alongside standard cloud deployment — see Net0's Government AI offering for the underlying architecture.
